Forex and other markets news
Which is Better: Fundamental or Technical Analysis

Which is Better: Fundamental or Technical Analysis
A trader should be familiar with fundamental and technical market analysis to trade successfully. This helps develop their trading style, as professional investors often endeavor to make decisions using both methods. However, many traders use only technical analysis and ignore fundamental analysis, so it's worth determining which is better.
Technical Analysis
Technical analysis is based on historical price data of trading instruments to determine potential support and resistance levels, as well as assumptions about future movement using behavioral models (patterns) that are repeated in the market from time to time. For example, it is commonly assumed that if the price bounces off a specific level or pivot point, it will do so again in the future.
Technical analysis tools include:
-
Trading levels
-
Candlestick patterns
-
Graphical models
-
Indicators
-
Trend lines
The tools listed above are used to visualize trading ideas better to understand the market situation for a specific currency pair. As a result, traders who prefer technical analysis over fundamental analysis frequently disregard the economic calendar because they get their trading signals from the chart.
Fundamental Analysis
Fundamental analysis studies macroeconomic and microeconomic data because they frequently have a significant impact on price, not only in the short term but also in the long term. These could include:
-
Inflation
-
Trade balance
-
GDP
-
Unemployment rate
-
Interest rate
So, if a trader works with the EURUSD currency pair, they should be familiar with all relevant information about the eurozone and the US economy, such as exports, imports, central bank interest rates, unemployment, mortgage market, political situation, and so on. Based on this data, the trader must calculate the weighted average currency rate and determine whether it is undervalued or overvalued. Since the release of economic news frequently causes high short-term volatility, traders try to capitalize on price fluctuations during this period.
For example, the news trading strategy is one of the most popular among beginners because it does not require any technical analysis, as traders only need to wait for the release of important news to decide on opening a trade. These are usually inflation or interest rates in the Eurozone and America, or the US Nonfarm, as they cause high market volatility.
Example of a Trading Situation on the Chart
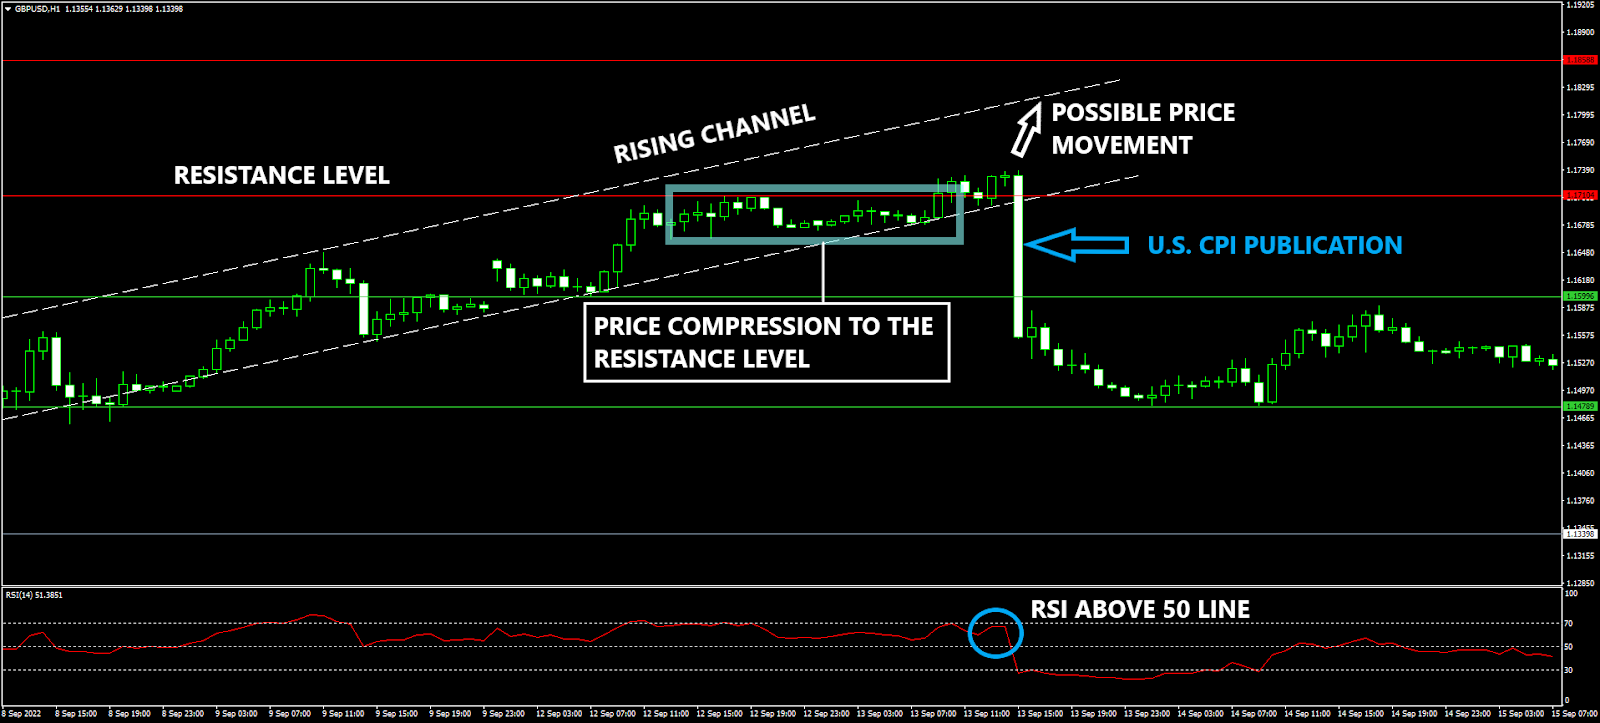
** GBPUSD H1 chart
On September 13, 2022, the US inflation data showed a 0.2% monthly increase, triggering a dollar spike and causing the GBPUSD pair to fall, breaking through two important trading levels.
According to the chart, before the news publication, the price could continue moving toward the upper border of the rising channel from a technical standpoint. At the same time, the RSI was above the 50-line, indicating that growth could continue. A price compression model to the resistance level is also visible, followed by a breakout and consolidation above this level.
However, the situation changed dramatically after the publication, indicating the importance of this economic news in evaluating the pair's behavior, which supports a fundamental analysis in this case.
However, in the intervals between the release of important economic news, currency pairs frequently follow technical analysis rules.
Summary
The best analysis depends entirely on the trader's strategy, goals, and trading style. Each analysis is unique in its own way. Fundamental analysis is better suited for long-term investments, whereas technical analysis is better suited for short- and mid-term trades. Nonetheless, a technical trader should be aware that fundamental analysis exists and is effective and that everyone should consult the economic calendar before trading sessions. So, if you're wondering which analysis best fits your needs, combining the two will be the most effective.
